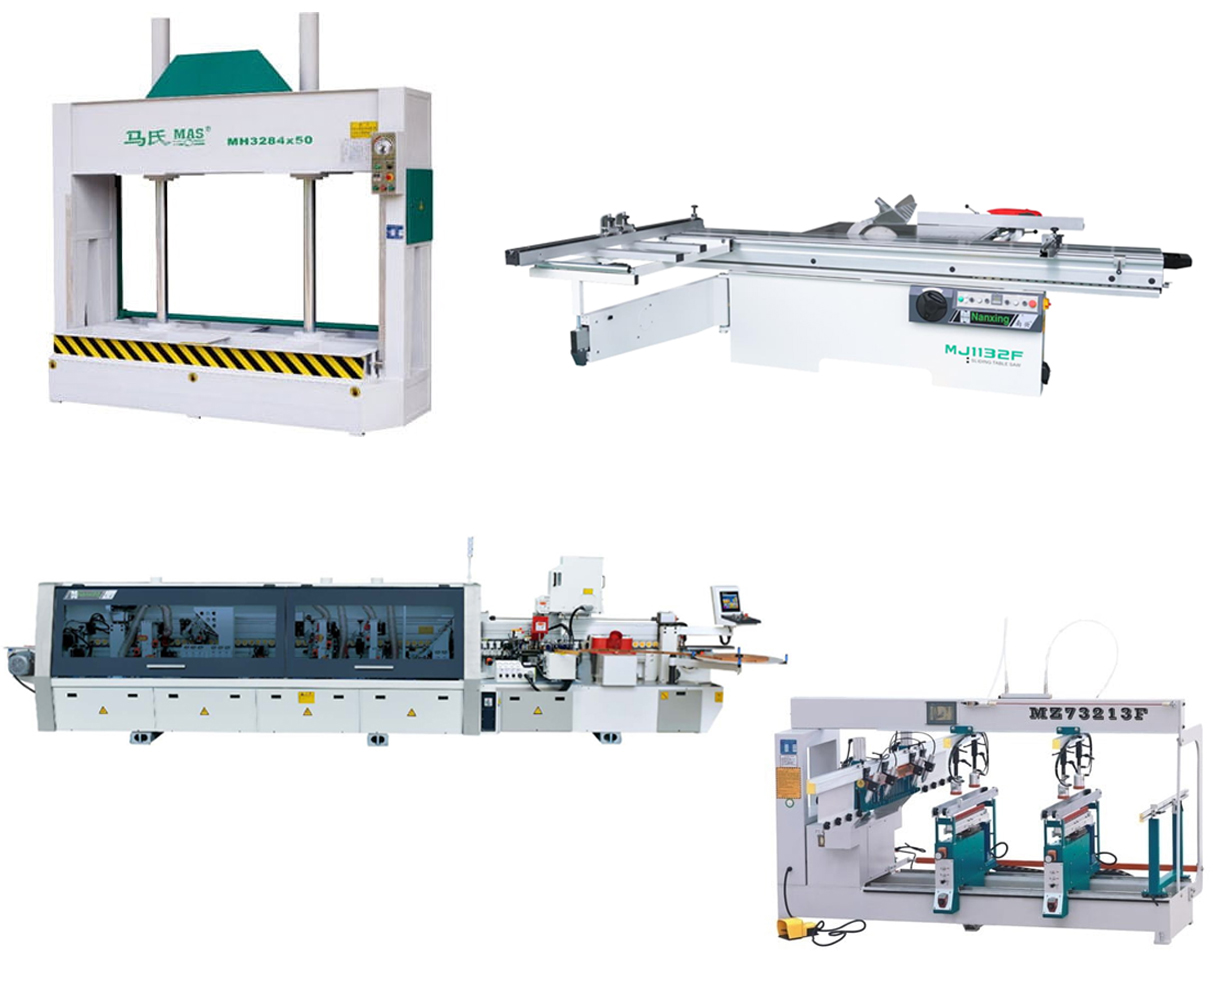
CIS-PPM-003 · 50 boards per day · indicative project configuration
50 boards/day cabinet making package: capacity basis, machines, manpower, zoning, 5-year projection and FAQs
Everything behind the CIS-PPM-003 indicative project configuration in one place: what 50 boards/day means, an indicative machine schedule, an indicative factory space and staffing plan, the route for each part family, an illustrative 5-year financial scenario with its assumptions, bank ratios, and answers to common buyer questions.
Capacity basis
50 boards/day is rated capacity: 8 × 4 ft boards the machines can process at full speed in one 8-hour shift. At 60% OEE the accepted board throughput is about 30 input boards/day converted into accepted parts, after changeovers, rework and inspection, or about 816 sq ft of saleable part area at 85% yield. The financial scenario sells this saleable area.
Capacity figures and OEE 8 figures
Capacity definitions used on this page| KPI | Definition | This package |
|---|
| Machine-rated capacity | Boards/day the machines can process at full speed, before OEE losses | 50 boards/day |
|---|
| Accepted board throughput | Standard 8 × 4 ft input boards a day converted into accepted parts | 30 boards/day |
|---|
| Material yield | Saleable part area ÷ raw board area consumed (offcuts and kerf are the loss) | 85% |
|---|
| Saleable part area | Accepted finished-part area a day after quality inspection | 816 sq ft |
|---|
| Finished-board equivalents | Saleable part area ÷ 32 sq ft | 25.5 a day |
|---|
Rated capacity
50 boards/day
At full speed, one shift
Accepted board throughput
30 boards/day
= rated × 60% OEE
Parts per shift
300
At 10 parts per board
Required parts per minute
1.04
288 net minutes per shift
Edges per minute
3.1
3 edged sides per part
Board area per day
89 m²
Accepted boards × 2.97 m²
Factory area
10,000 sq ft
Covered area
OEE = availability × performance × quality. One illustrative split is 80% × 85% × 88% ≈ 60%. The slowest department, often edge banding or drilling, sets the real output. Edges per minute is a workload indicator, not a machine count.
3-year ROI basis
A 3-year ROI here means the total investment of ₹2.03 Cr, not just the machine price, is recovered from the project's own free cash flow within three years. On one 8-hour shift that takes about 2.5 years. It is a payback test, not a fixed yearly return.
How the 3-year ROI is calculated Investment, cash flow, assumptions, margin
Total investment = machine package ₹38 L + supporting equipment quoted separately ₹28.1 L + other fixed assets ₹25.7 L + working capital ₹1.11 Cr = ₹2.03 Cr, GST extra.
How the investment is recovered, year by year
Project free cash flow and recovery| Year | Free cash flow | Recovered so far | Still to recover |
|---|
| Year 1 | ₹76.4 L | ₹76.4 L | ₹1.26 Cr |
|---|
| Year 2 | ₹78.0 L | ₹1.54 Cr | ₹48.1 L |
|---|
| Year 3 | ₹88.0 L | ₹2.42 Cr | Nil: recovered at ≈2.5 years |
|---|
Free cash flow = EBITDA less 30% tax on operating profit, less any increase in working capital. It is before loan interest and repayments; the bank loan is a separate three-year schedule, tested with DSCR (Year 1: 2.58×). Compare the basis across all plans.
Assumptions: one 8-hour shift, 300 working days, 60% OEE and the selling price, material, salary, growth and tax figures listed under the 5-year scenario below.
How much margin there is
Conservative case (lower Year-1 volume, then +3% a year): the investment is still recovered in 3 years if Year-1 volume reaches 92% of plan, a headroom of about 8%. A slower ramp-up, lower prices, dearer material or longer credit push payback past 3 years (see the stress figures below).
Confirm your order book in parts per shift, selling price, material cost, credit days and lender terms in a factory feasibility study before you invest.
Package details
Tap a section to open it.
Who this package suits
Growing modular kitchen and wardrobe makers
Workshops that have outgrown manual tools and need a CNC router, an automatic edge bander and dedicated boring for steady weekly volumes.
Retail-led furniture brands
Showroom businesses bringing production in-house, with about 10,000 sq ft and a 20-person crew in one shift.
Indicative machine schedule Indicative quantities
Indicative factory space and staffing plan
Quantities are preliminary planning assumptions. The ₹38 L package price covers the items marked "In package price"; items marked "Quoted separately" (₹28.1 L in total) are added in the financial scenario; "Other fixed assets" sit in the electricals, IT and racking allowance. Models and final quantities are fixed in the feasibility study.
Indicative machine schedule with indicative quantities| Department | Equipment | Qty (indicative) | Application | Status |
|---|
| Raw panel store | Floor stacks on pallets, panel trolleys | Stock for about 3 days; 2 panel trolleys | Receipt and stacking | Other fixed assets |
|---|
| Lamination | Hydraulic cold press | 1 | Pressing laminate or veneer with cold-setting glue | In package price |
|---|
| Lamination | Hot press | 0–1, only if you hot-press laminate or veneer in-house | Pressing laminate or veneer with heat-curing glue | Optional, quoted separately |
|---|
| Panel cutting | Sliding table panel saw | 1 | Straight cuts, thin panels, offcuts, repairs | In package price |
|---|
| Panel cutting and drilling | CNC nesting machine | 1 | Nested cutting, shaped parts, vertical drilling and grooving | Quoted separately |
|---|
| Edge banding | Automatic edge bander with pre-melt | 1 | Carcass parts and fronts | In package price |
|---|
| Drilling | Three-head boring machine | 1 | Hinge cups and line boring off the router | In package price |
|---|
| Sorting and kitting | Order-wise kitting trolleys | About 15 | Parts collected by order and cabinet | Other fixed assets |
|---|
| Assembly and packing | Work benches; carcass clamp | 6 benches; 1 clamp | Carcass assembly, hardware fitting, packing | Other fixed assets |
|---|
| Utilities | Dust collectors (CNC, edge bander, mobile unit), screw compressor with receiver, voltage stabiliser | 3 dust collectors; 1 compressor; 1 stabiliser | Every machine; earthing is part of the electrical installation | Quoted separately |
|---|
| Software and data | CAD/CAM nesting software, part label printer | 2 workstations; 1 label printer | Part identity and machine programmes | Other fixed assets |
|---|
The proposed area and staffing figures are preliminary planning assumptions, not a quotation or customer data. Final requirements are established through equipment selection, workflow analysis, factory layout, safety requirements, degree of automation and planned operating shifts.
Machine price breakup Package price + quoted separately
What the package price covers. The displayed package price is the sum of the four machines below at their current online prices, GST extra. Supporting equipment is quoted separately and is added on top in the financial scenario, so the investment on this page is complete.
Machine package price breakup, ₹ lakh (GST extra)| Machine | Model and key size | ₹ lakh |
|---|
| 1. Hydraulic cold press | CH3248-50TT · 1250 × 2500 mm · 50 t | ₹5.00 L |
|---|
| 2. Sliding table panel saw | MJ1132F · 3200 mm table · 6.6 kW | ₹4.50 L |
|---|
| 3. Automatic edge bander with pre-melt | NB536 · pneumatic glue gate | ₹21.50 L |
|---|
| 4. Three-head boring machine | MZ73213FJ | ₹7.00 L |
|---|
| Machine package price (GST extra) | = displayed price of the package | ₹38.00 L |
|---|
Supporting equipment quoted separately, ₹ lakh (GST extra)| Item | Indicative size | ₹ lakh |
|---|
| CNC nesting machine | NCG2812E · 9 kW spindle | ₹16.50 L |
|---|
| Dust collector for the CNC nesting machine, with ducting | 10 HP · 5,060 CMH | ₹2.75 L |
|---|
| Dust collector for the edge bander, with ducting | 10 HP · 6,625 CMH | ₹2.75 L |
|---|
| Mobile dust collector for the panel saw and boring machine | 5 HP · double bag | ₹0.75 L |
|---|
| Screw air compressor with receiver | 10 HP · 300 L | ₹4.25 L |
|---|
| Voltage stabiliser | 60 kVA · 3-phase | ₹1.10 L |
|---|
| Supporting equipment, quoted separately (GST extra) | Indicative; selection and sizing confirmed in the feasibility study | ₹28.10 L |
|---|
Total equipment investment, ₹ lakh (GST extra)| Item | ₹ lakh |
|---|
| Machine package price | ₹38.00 L |
|---|
| Supporting equipment, quoted separately | ₹28.10 L |
|---|
| Total equipment investment used in the financial scenario | ₹66.10 L |
|---|
Supporting-equipment prices are indicative Caple catalogue prices on the same basis as the package price. CAD/CAM software and computers, label printers, racking, trolleys, benches, the electrical installation and earthing are covered by the other fixed assets allowance. Models, sizes and prices are confirmed in a written proposal.
Indicative staffing plan by department Planning assumption
Indicative factory space and staffing plan
One 8-hour shift, totalling 20 factory staff. Several roles are combined at this size; operators are cross-trained between machines. Counts are rostered posts: they exclude relief cover for leave and absenteeism (typically add about 10%), trainees, security, contract housekeeping, outsourced transport, and designers, sales, showroom and installation teams.
Indicative staffing by department, one 8-hour shift| Department | People |
|---|
| Raw panel, hardware and finished-goods stores | 2 |
|---|
| Panel cutting (sliding table saw, CNC router) | 3 |
|---|
| Edge banding | 2 |
|---|
| Drilling | 2 |
|---|
| Sorting and kitting | 2 |
|---|
| Assembly and packing | 5 |
|---|
| Dispatch and loading | 1 |
|---|
| Quality | 1 |
|---|
| Maintenance | 1 |
|---|
| Supervisor and CAM programming | 1 |
|---|
| Total factory staff | 20 |
|---|
The proposed area and staffing figures are preliminary planning assumptions, not a quotation or customer data. Final requirements are established through equipment selection, workflow analysis, factory layout, safety requirements, degree of automation and planned operating shifts.
Indicative factory space plan Planning assumption
Indicative factory space and staffing plan
Shares of about 10,000 sq ft (929 m²) of covered area, laid out in material-flow order from panel receipt to dispatch. Keep expansion space beside the bottleneck department.
Indicative factory space plan| Zone | Share | sq ft | m² | Notes |
|---|
| Raw panel store and lamination | 15% | 1,500 | 139 | Stacks and racking; press area if you laminate in-house |
|---|
| Panel cutting and offcut store | 12% | 1,200 | 111 | Saw and router infeed and outfeed, labelled offcut rack |
|---|
| Edge banding | 8% | 800 | 74 | Machine length plus space to return parts for second passes |
|---|
| Drilling and part buffers | 6% | 600 | 56 | Trolley space in front of each drilling machine |
|---|
| Sorting and kitting | 6% | 600 | 56 | Order-wise trolleys |
|---|
| Assembly and hardware fitting | 15% | 1,500 | 139 | Benches and carcass clamp |
|---|
| Packing | 6% | 600 | 56 | Wrapping, cartons, labelling |
|---|
| Finished goods and dispatch staging | 10% | 1,000 | 93 | Staged by site or customer, next to the loading point |
|---|
| Hardware and consumables store | 4% | 400 | 37 | Fittings, edge-band rolls, glue, packing material |
|---|
| Utilities: dust collector, compressor, electrical panel | 4% | 400 | 37 | Dust collector filter often outside the building |
|---|
| Maintenance and tool corner | 2% | 200 | 19 | Tooling, sharpening, critical spares |
|---|
| Office, CAM, QC and welfare | 5% | 500 | 46 | Toilets, drinking water, first aid |
|---|
| Aisles and fire access | 7% | 700 | 65 | Clear marked routes; follow local fire code |
|---|
| Total covered area | 100% | 10,000 | 929 | |
|---|
Validate the layout for marked material-flow paths, pedestrian and forklift segregation, maintenance clearance, dust-extraction routes, emergency access, fire provisions and expansion space.
Part families and routes 6 routes
Each part family follows the shortest route that suits its size, thickness and processing. Confirm the routes from your own construction and drilling patterns.
Carcass parts
Sides, tops, bottoms, shelves
Panel saw or CNC nesting → automatic edge banding → drilling on the router, a boring machine or CNC drilling → kitting trolley.
Fronts
Shutters and drawer fronts
Panel saw or nesting → edge banding on all four sides → hinge boring or CNC drilling → kitting trolley, protected from scratches.
Narrow parts
Strips, rails, plinths
Cut as wider strips, edged, then ripped to final width where possible; otherwise use a narrow-part support on the edge bander.
Thin parts
Backs and drawer bottoms
Sliding table saw or nesting → usually no edging → straight to kitting or packing.
Shaped parts
Curved and contoured parts
CNC nesting → contour edging by hand or on a suitable machine → assembly.
Repairs and urgent parts
Rejects and replacements
Sliding table saw and edge bander in a quick repair slot each day → back into the order trolley.
Illustrative 5-year financial scenario Assumptions, P&L, balance sheet, cash flow
Illustrative financial scenario, not a guaranteed return or bank-approved project report. Package model for the 50 boards/day plan: 30 accepted boards/day (50 rated × 60% OEE), one 8-hour shift. Total project funding ₹2.03 Cr, of which the machine package ₹0.38 Cr and supporting equipment quoted separately ₹0.28 Cr, GST extra.
Assumptions (all visible in the downloadable Excel model)
- Accepted board throughput 30 boards/day (50 boards/day rated capacity × 60% OEE): standard 8 × 4 ft input boards converted into accepted parts, × 300 operating days × 27.2 sq ft of saleable part area per board (32 sq ft at 85% material yield) = 2.4 lakh sq ft a year. OEE is applied once, to the rated capacity; it is not applied again to revenue.
- Selling price ₹300 per saleable sq ft at the factory gate. Material ₹200 per saleable sq ft, all-in: board including offcuts and kerf at 85% yield (about ₹170 per raw board sq ft), edge band, adhesive, hardware and packing. One blended product mix at full planned output from Year 1, growing as below; a ramp-up case is shown under ROI.
- Salary ₹40,000 per head per month for 20 factory staff; overheads (rent, power, utilities, consumables) 6% of revenue (higher than the 4% used for the 500 and 1,000 plans, because fixed costs weigh more in a small plant), about half fixed and half variable. Premises assumed leased, with rent inside overheads; land and building are not in project funding.
- Other fixed assets: a provisional 3.5% of revenue for electrical installation, dust-extraction and compressed-air piping, IT, racking and handling, and civil changes, replaced by an itemised capital-expenditure schedule in the feasibility study.
- Depreciation straight line: machines 10%, supporting equipment 20%, other fixed assets 10%. Tax 30%. Interest 12% on the average term-loan balance and on the cash-credit limit.
- Funding: promoter 30% of total project funding; term loan 70% of gross fixed assets, repaid in three equal annual instalments; the balance is a cash-credit limit renewed annually.
- Growth from Year 2: volume +5% a year (OEE improving from 60% towards about 73%, within rated capacity, with no added shift or headcount), selling price +5% and material price +5% a year (gross margin held), salary per head +8% a year, the fixed half of overheads +6% a year and the variable half in line with revenue. Debtors, inventory and creditors grow with sales and are funded from profits; no dividends and no expansion capital expenditure. Surplus cash builds above the 75-day minimum operating buffer while the cash-credit limit stays drawn; in practice it would reduce the cash credit and its interest, so the model is conservative on interest.
- All values exclude GST. GST on machinery (18%) is paid upfront and is normally recoverable as input tax credit, subject to eligibility: a bridge-funding need, not a permanent project cost.
Project funding, ₹ crore| Item | ₹ crore |
|---|
| Machine package price (GST extra) | 0.38 |
|---|
| Supporting equipment, quoted separately (GST extra) | 0.281 |
|---|
| Other fixed assets (provisional allowance) | 0.26 |
|---|
| Net working capital | 1.11 |
|---|
| Total project funding | 2.03 |
|---|
| Promoter equity (30%) | 0.61 |
|---|
| Term loan | 0.64 |
|---|
| Cash credit | 0.78 |
|---|
Working capital build-up, ₹ crore| Item | Basis | ₹ crore |
|---|
| Debtors | 45 days of revenue | 0.91 |
|---|
| Inventory | 30 days of material, salary and overheads (39 days of material) | 0.52 |
|---|
| Cash buffer (minimum operating cash) | 75 days of salary and overheads | 0.29 |
|---|
| Less: creditors | 45 days of material | 0.60 |
|---|
| Net working capital | Cash cycle: 45 + 39 − 45 ≈ 39 days | 1.11 |
|---|
Profit and loss, ₹ crore| ₹ crore | Year 1 | Year 2 | Year 3 | Year 4 | Year 5 | Trend Y1→Y5 |
|---|
| Revenue | 7.34 | 8.10 | 8.93 | 9.84 | 10.85 | ▲ +10.3% a year, improving |
|---|
| Material (all-in) | 4.90 | 5.40 | 5.95 | 6.56 | 7.23 | ▲ +10.3% a year |
|---|
| Gross profit | 2.45 | 2.70 | 2.98 | 3.28 | 3.62 | ▲ +10.3% a year, improving |
|---|
| Salary | 0.96 | 1.04 | 1.12 | 1.21 | 1.31 | ▲ +8.0% a year |
|---|
| Overheads | 0.44 | 0.48 | 0.52 | 0.56 | 0.60 | ▲ +8.2% a year |
|---|
| EBITDA | 1.05 | 1.19 | 1.34 | 1.51 | 1.71 | ▲ +13.0% a year, improving |
|---|
| Depreciation | 0.10 | 0.10 | 0.10 | 0.10 | 0.10 | → steady |
|---|
| Interest, term loan | 0.06 | 0.04 | 0.01 | 0.00 | 0.00 | ▼ −0.06, improving |
|---|
| Interest, cash credit | 0.09 | 0.09 | 0.09 | 0.09 | 0.09 | → steady |
|---|
| Profit before tax | 0.79 | 0.95 | 1.13 | 1.32 | 1.51 | ▲ +17.7% a year, improving |
|---|
| Tax (30%) | 0.24 | 0.29 | 0.34 | 0.40 | 0.45 | ▲ +17.7% a year |
|---|
| Profit after tax | 0.55 | 0.67 | 0.79 | 0.92 | 1.06 | ▲ +17.7% a year, improving |
|---|
Balance sheet at year end, ₹ crore (assets equal liabilities every year)| ₹ crore | Year 1 | Year 2 | Year 3 | Year 4 | Year 5 | Trend Y1→Y5 |
|---|
| Share capital (promoter equity) | 0.61 | 0.61 | 0.61 | 0.61 | 0.61 | → steady |
|---|
| Reserves (retained profit) | 0.55 | 1.22 | 2.01 | 2.93 | 3.99 | ▲ +3.44 |
|---|
| Net worth | 1.16 | 1.82 | 2.62 | 3.54 | 4.60 | ▲ +41.1% a year, improving |
|---|
| Term loan outstanding | 0.43 | 0.21 | 0.00 | 0.00 | 0.00 | ▼ −0.43, improving |
|---|
| of which due within 12 months | 0.21 | 0.21 | 0.00 | 0.00 | 0.00 | ▼ −0.21, improving |
|---|
| Cash credit (limit held) | 0.78 | 0.78 | 0.78 | 0.78 | 0.78 | → steady |
|---|
| Creditors | 0.60 | 0.67 | 0.73 | 0.81 | 0.89 | ▲ +10.3% a year |
|---|
| Total equity and liabilities | 2.97 | 3.48 | 4.12 | 5.12 | 6.26 | ▲ +20.5% a year |
|---|
| Net fixed assets | 0.81 | 0.71 | 0.61 | 0.50 | 0.40 | ▼ −0.41 |
|---|
| Debtors | 0.91 | 1.00 | 1.10 | 1.21 | 1.34 | ▲ +10.3% a year |
|---|
| Inventory | 0.52 | 0.57 | 0.62 | 0.68 | 0.75 | ▲ +9.8% a year |
|---|
| Cash and bank, incl. buffer | 0.73 | 1.20 | 1.79 | 2.72 | 3.77 | ▲ +50.9% a year, improving |
|---|
| Total assets | 2.97 | 3.48 | 4.12 | 5.12 | 6.26 | ▲ +20.5% a year |
|---|
Cash-flow statement, ₹ crore (closing cash equals the balance sheet)| ₹ crore | Year 1 | Year 2 | Year 3 | Year 4 | Year 5 |
|---|
| Opening cash and bank | 0.29 | 0.73 | 1.20 | 1.79 | 2.72 |
|---|
| Cash accrual (PAT + depreciation) | 0.65 | 0.77 | 0.90 | 1.03 | 1.16 |
|---|
| Change in working capital | 0.00 | -0.08 | -0.09 | -0.10 | -0.11 |
|---|
| Term-loan principal repaid | -0.21 | -0.21 | -0.21 | 0.00 | 0.00 |
|---|
| Net cash flow | 0.44 | 0.47 | 0.59 | 0.93 | 1.05 |
|---|
| Closing cash and bank | 0.73 | 1.20 | 1.79 | 2.72 | 3.77 |
|---|
Operational efficiency ratios| Ratio | Year 1 | Year 2 | Year 3 | Year 4 | Year 5 | Trend Y1→Y5 |
|---|
| Revenue growth | — | 10.3% | 10.2% | 10.3% | 10.3% | → steady |
|---|
| Volume index (Year 1 = 100) | 100.0 | 105.0 | 110.2 | 115.8 | 121.6 | ▲ +5.0% a year, improving |
|---|
| Gross margin | 33.3% | 33.3% | 33.3% | 33.3% | 33.3% | → steady |
|---|
| Material, % of revenue | 66.7% | 66.7% | 66.7% | 66.7% | 66.7% | → steady |
|---|
| Salary, % of revenue | 13.1% | 12.8% | 12.5% | 12.3% | 12.0% | ▼ −1.0 pp, improving |
|---|
| Overheads, % of revenue | 6.0% | 5.9% | 5.8% | 5.7% | 5.6% | ▼ −0.4 pp, improving |
|---|
| Revenue per head (₹ lakh) | 36.7 | 40.5 | 44.6 | 49.2 | 54.3 | ▲ +10.3% a year, improving |
|---|
| Asset turnover (revenue ÷ total assets) | 2.48× | 2.33× | 2.16× | 1.92× | 1.73× | ▼ −0.74×, weakening |
|---|
| Fixed-asset turnover | 9.02× | 11.38× | 14.69× | 19.51× | 27.06× | ▲ +18.04×, improving |
|---|
| Debtor days | 45 | 45 | 45 | 45 | 45 | → steady |
|---|
| Inventory days (on material) | 39 | 38 | 38 | 38 | 38 | ▼ −1 days, improving |
|---|
| Creditor days | 45 | 45 | 45 | 45 | 45 | → steady |
|---|
| Cash conversion cycle (days) | 39 | 38 | 38 | 38 | 38 | ▼ −1 days, improving |
|---|
Financial ratios| Ratio | Year 1 | Year 2 | Year 3 | Year 4 | Year 5 | Trend Y1→Y5 |
|---|
| EBITDA margin | 14.3% | 14.6% | 15.0% | 15.4% | 15.7% | ▲ +1.5 pp, improving |
|---|
| PAT margin | 7.5% | 8.2% | 8.9% | 9.4% | 9.7% | ▲ +2.2 pp, improving |
|---|
| ROCE | 40.0% | 38.5% | 36.5% | 32.7% | 29.9% | ▼ −10.1 pp, weakening |
|---|
| ROE on average equity | 62.4% | 44.6% | 35.7% | 30.0% | 26.0% | ▼ −36.4 pp, weakening |
|---|
| PAT on initial promoter equity | 90.6% | 109.5% | 130.3% | 151.8% | 174.1% | ▲ +83.4 pp, improving |
|---|
| Current ratio | 1.35× | 1.67× | 2.33× | 2.92× | 3.52× | ▲ +2.17×, improving |
|---|
| Quick ratio | 1.03× | 1.33× | 1.92× | 2.48× | 3.07× | ▲ +2.04×, improving |
|---|
| Debt (TL + CC) ÷ net worth | 1.04× | 0.54× | 0.30× | 0.22× | 0.17× | ▼ −0.87×, improving |
|---|
| Debt ratio (liabilities ÷ assets) | 60.9% | 47.6% | 36.6% | 30.9% | 26.6% | ▼ −34.3 pp, improving |
|---|
| Interest coverage (EBITDA ÷ interest) | 6.66× | 9.01× | 12.66× | 16.28× | 18.36× | ▲ +11.70×, improving |
|---|
| DSCR (years with term-loan repayment) | 2.58× | 3.19× | 4.00× | — | — | ▲ +1.42×, improving |
|---|
Project free cash flow, ₹ crore (Year 0 = total project funding)| ₹ crore | Year 0 | Year 1 | Year 2 | Year 3 | Year 4 | Year 5 |
|---|
| Project free cash flow (after tax, after working capital, before financing) | -2.03 | 0.76 | 0.78 | 0.88 | 0.99 | 1.12 |
|---|
| Cumulative | -2.03 | -1.26 | -0.48 | 0.40 | 1.39 | 2.51 |
|---|
Reading the trend: margins improve slowly because salaries and fixed overheads grow more slowly than revenue, while gross margin is held because selling and material prices move together. ROCE and ROE on average equity ease because retained profit and cash build up on the balance sheet; surplus cash would first reduce cash-credit use. Growth depends on orders and price acceptance; the sensitivity and ramp-up cases below show the downside.
Cash-accrual coverage period: cumulative cash accruals equal initial bank finance of ₹1.42 Cr in about 2.2 years under these assumptions. This is not a loan-repayment commitment: the term loan is repaid over three years, as the balance sheet and cash-flow statement show, and the cash-credit limit is assessed separately. Project payback on free cash flow is about 2.5 years. Scroll sideways on mobile to see all years.
ROI and bankability ratios Three-stage bankability, sensitivity, ramp-up
Illustrative financial scenario, not a guaranteed return or bank-approved project report. Year 1 of the reconciled package model, for the 50 boards/day plan (30 accepted boards/day, one shift), ₹300 per saleable sq ft, ₹40,000 average monthly salary and 30:70 equity-to-bank funding.
ROCE − WACC spread
28.7 pp
ROCE 40.0% less post-tax WACC 11.3%
Minimum DSCR, loan life
2.58×
Average 3.26× while the term loan runs
Cash-accrual coverage period
2.2 years
Initial bank finance ÷ Year-1 cash accrual; not a repayment date
Project payback
2.5 years
Cumulative project free cash flow
Total funding coverage
3.1 years
Total funding ÷ Year-1 cash accrual
Year-by-year margins, returns, liquidity, leverage and DSCR are in the financial ratios table above.
Bankability view in three stages| Stage | Measure | This model | Illustrative screening criterion |
|---|
| Initial funding | Bank debt (TL + CC) ÷ promoter equity | 2.33× | Assessed with collateral and promoter profile |
|---|
| Initial funding | Promoter contribution | 30% | ≥ 25% margin |
|---|
| Initial funding | Term loan ÷ gross fixed assets | 70% | ≤ 75% |
|---|
| Year 1 | Current ratio (current portion of term loan in current liabilities) | 1.35× | ≥ 1.33× |
|---|
| Year 1 | Quick ratio | 1.03× | ≥ 1.00× |
|---|
| Year 1 | DSCR | 2.58× | ≥ 1.50× |
|---|
| Year 1 | Debt (TL + CC) ÷ closing net worth | 1.04× | ≤ 2.00× |
|---|
| Year 1 | Interest coverage (EBITDA ÷ interest) | 6.66× | ≥ 2.00× |
|---|
| Year 1 | ROCE / EBITDA margin / PAT margin | 40.0% / 14.3% / 7.5% | ≥ 12% / 12% / 5% |
|---|
| Loan life | Minimum / average DSCR while the term loan runs | 2.58× / 3.26× | ≥ 1.50× |
|---|
| Loan life | Current ratio range, Years 1–5 | 1.35× – 3.52× | ≥ 1.33× |
|---|
The criteria are illustrative screening levels used in this model, not universal bank approval requirements. Each lender applies its own norms by applicant, collateral, loan type, industry risk and projected cash flows. DSCR = (PAT + depreciation + term-loan interest) ÷ (term-loan principal + term-loan interest): it covers scheduled term-loan service only; cash-credit interest is already deducted in PAT, and the cash-credit limit is revolving, with no scheduled principal. The current portion of the term loan is shown inside current liabilities; the total term-loan liability is unchanged.
Year-1 sensitivity, ₹ crore (same funding)| Scenario | Revenue | EBITDA | PAT | DSCR | Coverage period |
|---|
| Base case | 7.34 | 1.05 | 0.55 | 2.58× | 2.2 years |
|---|
| Volume −15% | 6.24 | 0.71 | 0.32 | 1.74× | 3.4 years |
|---|
| Selling price −5% | 6.98 | 0.69 | 0.30 | 1.68× | 3.5 years |
|---|
| Material cost +5% | 7.34 | 0.80 | 0.38 | 1.96× | 2.9 years |
|---|
| Combined stress: volume −15%, price −5%, material +5%, interest 13%, debtors 60 days | 5.93 | 0.20 | -0.10 | 0.25× | Not covered |
|---|
| Optimistic: volume +5%, price +3%, material −2% | 7.94 | 1.49 | 0.86 | 3.68× | 1.5 years |
|---|
Ramp-up case, ₹ crore (debt schedule unchanged)| ₹ crore | Year 1 | Year 2 | Year 3 | Year 4 | Year 5 |
|---|
| Utilisation | 70% | 85% | 100% | 100% | 100% |
|---|
| Revenue | 5.14 | 6.88 | 8.93 | 9.84 | 10.85 |
|---|
| EBITDA | 0.38 | 0.82 | 1.34 | 1.51 | 1.71 |
|---|
| Profit after tax | 0.08 | 0.41 | 0.79 | 0.92 | 1.06 |
|---|
| DSCR | 0.90× | 2.17× | 4.00× | — | — |
|---|
Scenarios hold salaries and the fixed half of overheads; variable overheads and material move with volume; extra debtor days are funded by cash credit. They are illustrative recomputations, not forecasts; your feasibility study tests your own prices, costs and ramp-up.
Earlier published growth table (kept for reference) Superseded
Kept for reference. The earlier table published on this page, unchanged. Its growth path is now built into the 5-year projection above on the corrected basis (average-balance interest, three-year term loan, working capital growing with sales), so use the projection above for planning. The earlier table let gross margin widen from 33% to 39%; the projection above holds it, because selling and material prices move together.
Earlier 5-year growth table as published, ₹ crore (superseded)| Item (₹ crore) | Y1 | Y2 | Y3 | Y4 | Y5 |
|---|
| Revenue | 7.34 | 8.07 | 8.88 | 9.77 | 10.75 |
|---|
| COGS | 4.90 | 5.27 | 5.66 | 6.09 | 6.54 |
|---|
| Gross Profit | 2.45 | 2.81 | 3.22 | 3.68 | 4.20 |
|---|
| Salary | 0.96 | 1.03 | 1.11 | 1.19 | 1.28 |
|---|
| Overheads | 0.44 | 0.47 | 0.51 | 0.55 | 0.59 |
|---|
| EBITDA | 1.05 | 1.30 | 1.60 | 1.94 | 2.33 |
|---|
| Depreciation | 0.09 | 0.09 | 0.09 | 0.09 | 0.09 |
|---|
| Interest | 0.13 | 0.11 | 0.10 | 0.09 | 0.08 |
|---|
| PBT | 0.83 | 1.10 | 1.41 | 1.76 | 2.17 |
|---|
| Tax (30%) | 0.25 | 0.33 | 0.42 | 0.53 | 0.65 |
|---|
| PAT | 0.58 | 0.77 | 0.99 | 1.24 | 1.52 |
|---|
| Fixed Assets (net) | 0.42 | 0.33 | 0.24 | 0.15 | 0.06 |
|---|
| Current Assets | 2.45 | 2.78 | 3.16 | 3.58 | 4.05 |
|---|
| Equity + Term Loan | 1.13 | 1.39 | 1.69 | 2.04 | 2.44 |
|---|
| Current Liab. (incl. CC) | 1.74 | 1.72 | 1.71 | 1.69 | 1.67 |
|---|
| Total (Assets = Eq+Liab) | 2.87 | 3.11 | 3.40 | 3.73 | 4.11 |
|---|
| EBITDA margin | 14.3% | 16.1% | 18.0% | 19.9% | 21.7% |
|---|
| PAT margin | 7.9% | 9.5% | 11.2% | 12.7% | 14.1% |
|---|
What the feasibility study confirms
- Your order dataset: total parts, unique designs, part-family mix, material and edge-code variety.
- The bottleneck department and accepted output per shift for each department at your mix, not catalogue feed speed.
- Machine quantities, models and options for every line in the configuration schedule.
- Factory zoning: raw panel store, cutting, edging, drilling, sorting, assembly, packing, finished goods, dispatch, utilities, dust extraction and expansion space.
- Manpower by department and shift, including supervisors, maintenance, quality and stores.
- Part size windows, materials, surfaces (including high-gloss or protective film) and permitted laminate overhang.
- Part labelling with a unique QR or Data Matrix code, and the data interfaces between design software, MES and each machine.
- Ramp-up, selling price, material cost and working-capital days from your own business, turned into a project report for your bank.
- Required rate → proposed capacity → headroom for each department, from cycle times on a standard set of your representative parts: saw stack height, pattern efficiency and changeovers; edge-banding feed speed, gaps, returns and glue changes; drilling patterns and tool changes; sorting buffer positions; assembly and packing rates.
- Utilities: dust-extraction air volume, compressed-air pressure and flow, and connected electrical load with safety margins.
- An itemised capital-expenditure schedule (electrical, dust extraction, compressed air, IT, racking, civil changes) and the premises basis: owned, leased, new build or existing.
- Reference parts agreed before ordering, and an acceptance test proven on them at installation.
Questions about the 50 boards/day package 12 FAQs
What is the 50 boards/day cabinet making package?
It is an indicative project configuration for a small cabinet and modular furniture factory: panel cutting, CNC nesting, automatic edge banding, drilling, assembly, dust extraction and compressed air, planned for 50 boards/day of rated capacity in one 8-hour shift. Caple Industrial Solutions supplies it under one accountable contract with pan-India service, after a factory feasibility study confirms your products and output.
What does 50 boards/day measure?
Rated capacity: the boards/day the machines can process at full speed in one shift. At 60% overall equipment effectiveness (OEE), the accepted board throughput is about 30 standard input boards/day converted into accepted parts, about 816 sq ft of saleable part area at 85% material yield (25.5 finished-board equivalents). The financial scenario sells exactly that area. The 500 and 1,000 plans are named by accepted board throughput instead.
How many parts per shift and per minute must the factory produce?
At 10 parts per board, 30 accepted boards/day is about 300 parts per shift, or 1.04 parts per minute over 288 net minutes, and about 3.1 edges per minute at three edged sides per part. Recalculate with your own order data, as kitchens, wardrobes and project work vary widely.
Which machines does the package price include, and what is quoted separately?
The ₹38 L package price (GST extra) covers four machines: hydraulic cold press CH3248-50TT; sliding table panel saw MJ1132F; automatic edge bander with pre-melt NB536; three-head boring machine MZ73213FJ. Quoted separately, at about ₹28.1 L: CNC nesting machine, plus dust collectors, compressed air and a voltage stabiliser. The machine price breakup above lists each item. CAD/CAM, label printers, racking, trolleys, benches and electricals sit in the other fixed assets allowance. Final models, options and quantities are fixed in the feasibility study from your cutting lists and CAD/CAM files.
How many people are needed, and in which departments?
Indicative staffing plan: 20 factory staff in one shift: raw panel, hardware and finished-goods stores 2, panel cutting (sliding table saw, CNC router) 3, edge banding 2, drilling 2, sorting and kitting 2, assembly and packing 5, dispatch and loading 1, quality 1, maintenance 1, supervisor and CAM programming 1. Counts are rostered posts; add about 10% relief for leave and absenteeism. Designers, sales, showroom and installation teams are extra.
How much factory space is needed, and how is it zoned?
About 10,000 sq ft (929 m²) of covered area. An indicative split gives about 15% to the raw panel store, 12% to cutting, 8% to edge banding, 15% to assembly, 10% to finished goods and dispatch and 7% to aisles and fire access, laid out in material-flow order. The real layout comes from your site survey.
What investment and funding does the package assume?
Machine package price ₹38 L (GST extra), supporting equipment quoted separately ₹28.1 L, other fixed assets such as electricals, IT and racking ₹25.7 L, and net working capital ₹1.11 Cr: total project funding ₹2.03 Cr, all excluding GST. Funding assumes 30% promoter equity (₹60.8 L) and 70% bank finance (₹1.42 Cr: term loan ₹64.3 L plus cash credit ₹77.5 L). Earlier versions of this page labelled the other fixed assets as "pre-operative and GST ITC"; they are electricals, IT and racking.
What does the 3-year ROI mean for this package?
The total investment of ₹2.03 Cr (machines, supporting equipment, other fixed assets and working capital) is paid back from project free cash flow, after tax and before loan payments, in about 2.5 years on one 8-hour shift. It still holds if Year-1 volume reaches 92% of plan. It is a planning estimate, not a guaranteed return.
How quickly is the bank loan repaid, and is the return guaranteed?
In the illustrative scenario the term loan follows a three-year schedule of equal annual instalments of ₹21.4 L. Year-1 cash accrual (profit after tax plus depreciation) is ₹65.4 L, so the indicative cash-accrual coverage period is about 2.2 years for bank finance and 3.1 years for total funding; this is not a loan-repayment commitment. Small plants have thin margins: in the combined stress case (volume −15%, price −5%, material +5%, interest 13%, debtors 60 days) Year-1 profit after tax turns to a loss of about ₹10.3 L, and with a 70% first-year ramp-up Year-1 DSCR is about 0.90×, so plan the ramp-up and working capital with your bank. Year-1 DSCR is 2.58× and the current ratio 1.35×. Project free cash flow recovers the total investment of ₹2.03 Cr in about 2.5 years on one 8-hour shift. An earlier version of this page showed "years to be bank-free 1.4"; it has been restated on the corrected model. Returns are not guaranteed; your bank appraises its own project report.
When should I move up to the 75 boards/day package?
When confirmed orders keep the 50 boards/day plan busy for most of the shift, or a second shift is not practical. Convert your order book into parts per shift, find the bottleneck department (often edge banding or drilling), then check cash flow, loan repayments, space and team readiness before adding capacity.
What utilities does the factory need?
Dust extraction sized from the connected machines and air velocity in the ducts; dry, clean compressed air at the pressure each machine needs; stable power with correct earthing, surge protection and a stabiliser where supply fluctuates. These are sized in the feasibility study from the connected load.
What do I need to send for a feasibility study?
Your products and typical cabinets, a month of real orders or cutting lists, board sizes and materials, edge types, hardware and drilling patterns, the site size and a rough layout, power supply details and your target output. We return the bottleneck, machine quantities, layout, manpower and a project report your bank can appraise.
Request a factory feasibility study for 50 boards/day
Send your cutting lists or a month of orders, your site size and target output. We confirm the bottleneck, machine quantities, layout, manpower and a project report your bank can appraise.
Or send your planning brief from the project requirements list, or WhatsApp +91 70454 59931.
Related guides
Illustrative financial scenario, not a guaranteed return or bank-approved project report. Machinery prices are indicative; machine list, quantities, capacities, staffing, layout and investment are confirmed in a written, project-specific proposal from Caple Industrial Solutions. Customer layouts and project data stay in the private proposal. Revised 26 October 2026: current four-machine package prices, supporting equipment quoted separately, 3-year ROI basis, corrected model and an indicative staffing plan. Warranty shown on this page: limited to manufacturing defects in supplied machines, back-to-back with the manufacturer's policy, subject to full payment; wear parts and consumables are excluded. Installation, commissioning, training and after-sales scope are fixed in the written proposal.