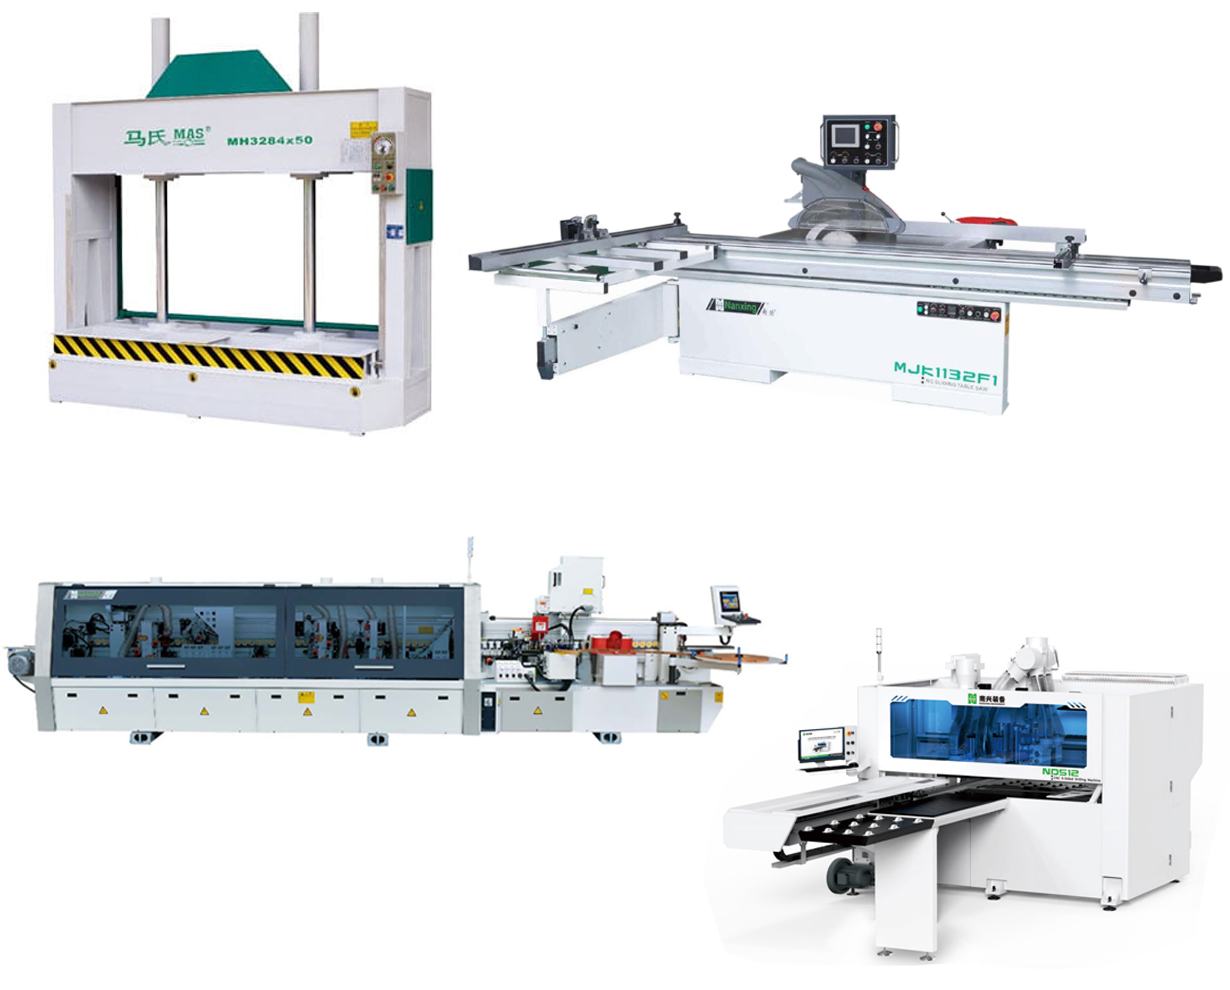

75 boards/day | Cabinet Making Package
₹6,800,000.00 ₹8,500,000.00
• 75 boards/day | Cabinet Making Package
Choose Quantity
TEST
Factory ROI Analysis — All Packages
Every Caple factory package side-by-side. Boards per shift across the top, all financial metrics stacked below. Click any column header to open that product page.
| Package capacity | 25/day | 50/day | 75/day | 100/day | 500/day | 1000/day |
|---|---|---|---|---|---|---|
| 01 · Capacity | ||||||
| Boards / day | 25 | 50 | 75 | 100 | 500 | 1000 |
| Shifts / day | 1 | 1 | 1 | 1 | 2 | 2 |
| Working days / month | 25 | 25 | 25 | 25 | 25 | 25 |
| Boards / year | 7,500 | 15,000 | 22,500 | 30,000 | 300,000 | 600,000 |
| Finished sq ft / year | 192,000 | 384,000 | 576,000 | 768,000 | 7.68M | 15.36M |
| 02 · Area in Sq Feet | ||||||
| Factory area | 5,000 sq ft | 10,000 sq ft | 15,000 sq ft | 20,000 sq ft | 100,000 sq ft | 200,000 sq ft |
| Boards per sq ft / yr | 1.5 | 1.5 | 1.5 | 1.5 | 3.0 | 3.0 |
| Revenue density (per sq ft / yr) | ₹10,000 | ₹10,000 | ₹10,000 | ₹10,000 | ₹10,000 | ₹10,000 |
| Revenue per 10,000 sq ft / yr | ₹1 Cr | ₹1 Cr | ₹1 Cr | ₹1 Cr | ₹1 Cr | ₹1 Cr |
| 03 · People & Departments | ||||||
| Total team | 20 | 40 | 60 | 80 | 400 | 800 |
| Revenue per employee | ₹25L | ₹25L | ₹25L | ₹25L | ₹50L | ₹50L |
| Avg salary (per person / month) | ₹40K | ₹40K | ₹40K | ₹40K | ₹80K | ₹80K |
| People per 100 boards/day | 80 | 80 | 80 | 80 | 80 | 80 |
| M/c Operators + Helpers | 6 | 13 | 19 | 26 | 128 | 256 |
| CAD/CAM Software | 2 | 3 | 5 | 6 | 32 | 64 |
| Managers | 1 | 1 | 2 | 2 | 11 | 21 |
| Sales | 2 | 3 | 5 | 6 | 32 | 64 |
| Support | 2 | 3 | 5 | 6 | 32 | 64 |
| Site Installation | 5 | 14 | 19 | 28 | 133 | 267 |
| Accounts | 1 | 2 | 3 | 4 | 21 | 43 |
| Partners (Sweat) | 1 | 1 | 2 | 2 | 11 | 21 |
| Total annual salary cost (all 9 roles) | ₹1Cr (19%) | ₹2Cr (19%) | ₹3Cr (19%) | ₹4Cr (19%) | ₹38Cr (19%) | ₹77Cr (19%) |
| └ Manufacturing roles → absorbed in COGS | ₹73L (15%) | ₹1Cr (15%) | ₹2Cr (15%) | ₹3Cr (15%) | ₹29Cr (15%) | ₹58Cr (15%) |
| └ Showroom / Sales / Admin → absorbed in OpEx | ₹23L (5%) | ₹46L (5%) | ₹69L (5%) | ₹92L (5%) | ₹9Cr (5%) | ₹18Cr (5%) |
| 04 · Investment in Machines | ||||||
| Caple m/c investment (100) | ₹28L | ₹51L | ₹85L | ₹1Cr | ₹35Cr | ₹50Cr |
| Supporting m/c investment (20) | ₹6L | ₹10L | ₹17L | ₹29L | ₹7Cr | ₹10Cr |
| Working capital (90 days) | ₹1Cr | ₹2Cr | ₹4Cr | ₹5Cr | ₹49Cr | ₹99Cr |
| Bank / Buffer (30 days) | ₹41L | ₹82L | ₹1Cr | ₹2Cr | ₹16Cr | ₹33Cr |
| Total Capex Required | ₹2Cr | ₹4Cr | ₹6Cr | ₹8Cr | ₹108Cr | ₹192Cr |
| Self investment (50%) | ₹1Cr | ₹2Cr | ₹3Cr | ₹4Cr | ₹54Cr | ₹96Cr |
| Bank loan (50%) | ₹1Cr | ₹2Cr | ₹3Cr | ₹4Cr | ₹54Cr | ₹96Cr |
| Interest on Bank Loan (12% secured) — P&L expense | ₹12L | ₹23L | ₹36L | ₹50L | ₹6Cr | ₹11Cr |
| Opportunity cost on Self Capital (18% hurdle) | ₹18L | ₹35L | ₹54L | ₹75L | ₹10Cr | ₹17Cr |
| Annual depreciation (15%/yr on machines) | ₹5L | ₹9L | ₹15L | ₹26L | ₹6Cr | ₹9Cr |
| 05 · Balance Sheet — Liabilities | ||||||
| Capital / Equity (50%) | ₹1Cr | ₹2Cr | ₹3Cr | ₹4Cr | ₹54Cr | ₹96Cr |
| Reserves (Yr 1 FCF retained) | ₹32L | ₹64L | ₹1Cr | ₹1Cr | ₹9Cr | ₹21Cr |
| Term Loan — long term (50%) | ₹1Cr | ₹2Cr | ₹3Cr | ₹4Cr | ₹54Cr | ₹96Cr |
| Non-Current Liabilities | ₹2Cr | ₹5Cr | ₹7Cr | ₹10Cr | ₹117Cr | ₹213Cr |
| Vendor Payables (45 days) | ₹62L | ₹1Cr | ₹2Cr | ₹2Cr | ₹25Cr | ₹49Cr |
| Current Liabilities | ₹62L | ₹1Cr | ₹2Cr | ₹2Cr | ₹25Cr | ₹49Cr |
| Total Liabilities | ₹3Cr | ₹6Cr | ₹9Cr | ₹12Cr | ₹142Cr | ₹262Cr |
| 05 · Balance Sheet — Assets | ||||||
| Fixed Assets — Machines (net) | ₹34L | ₹61L | ₹1Cr | ₹2Cr | ₹42Cr | ₹60Cr |
| Non-Current Assets | ₹34L | ₹61L | ₹1Cr | ₹2Cr | ₹42Cr | ₹60Cr |
| Inventory (RM + WIP + FG, 90d) | ₹1Cr | ₹2Cr | ₹4Cr | ₹5Cr | ₹49Cr | ₹99Cr |
| Debtors (90 days) | ₹1Cr | ₹2Cr | ₹4Cr | ₹5Cr | ₹49Cr | ₹99Cr |
| Bank / Cash + Retained FCF | ₹73L | ₹1Cr | ₹2Cr | ₹3Cr | ₹26Cr | ₹54Cr |
| Current Assets | ₹3Cr | ₹6Cr | ₹10Cr | ₹13Cr | ₹124Cr | ₹251Cr |
| Total Assets | ₹3Cr | ₹6Cr | ₹9Cr | ₹13Cr | ₹150Cr | ₹279Cr |
| 06 · Profit & Loss (Annual) | ||||||
| Revenue | ₹5Cr (100%) | ₹10Cr (100%) | ₹15Cr (100%) | ₹20Cr (100%) | ₹200Cr (100%) | ₹400Cr (100%) |
| Material | ₹2Cr (50%) | ₹5Cr (50%) | ₹8Cr (50%) | ₹10Cr (50%) | ₹100Cr (50%) | ₹200Cr (50%) |
| Manufacturing salary + direct G&A (16%) | ₹80L (16%) | ₹2Cr (16%) | ₹2Cr (16%) | ₹3Cr (16%) | ₹32Cr (16%) | ₹64Cr (16%) |
| COGS | ₹3Cr (66%) | ₹7Cr (66%) | ₹10Cr (66%) | ₹13Cr (66%) | ₹132Cr (66%) | ₹264Cr (66%) |
| Gross Margin | ₹2Cr (34%) | ₹3Cr (34%) | ₹5Cr (34%) | ₹7Cr (34%) | ₹68Cr (34%) | ₹136Cr (34%) |
| Showroom + Sales + Admin OpEx (20%) | ₹1Cr (20%) | ₹2Cr (20%) | ₹3Cr (20%) | ₹4Cr (20%) | ₹40Cr (20%) | ₹80Cr (20%) |
| EBITDA / Operating Profit | ₹70L (14%) | ₹1Cr (14%) | ₹2Cr (14%) | ₹3Cr (14%) | ₹28Cr (14%) | ₹56Cr (14%) |
| Depreciation (15%/yr on machines) | ₹5L (1%) | ₹9L (1%) | ₹15L (1%) | ₹26L (1%) | ₹6Cr (3%) | ₹9Cr (2%) |
| EBIT — after Depreciation | ₹65L (13%) | ₹1Cr (13%) | ₹2Cr (13%) | ₹3Cr (13%) | ₹22Cr (11%) | ₹47Cr (12%) |
| Interest (Bank Loan 12% secured) | ₹12L (2%) | ₹23L (2%) | ₹36L (2%) | ₹50L (2%) | ₹6Cr (3%) | ₹11Cr (3%) |
| PBT — after Depreciation and Interest | ₹53L (11%) | ₹1Cr (11%) | ₹2Cr (11%) | ₹2Cr (10%) | ₹15Cr (8%) | ₹36Cr (9%) |
| Income Tax (25%) | ₹13L (3%) | ₹27L (3%) | ₹40L (3%) | ₹51L (3%) | ₹4Cr (2%) | ₹9Cr (2%) |
| PAT — Profit After Tax | ₹40L (8%) | ₹81L (8%) | ₹1Cr (8%) | ₹2Cr (8%) | ₹11Cr (6%) | ₹27Cr (7%) |
| Drawings (20% of PAT) — owner withdrawal | ₹8L (2%) | ₹16L (2%) | ₹24L (2%) | ₹31L (2%) | ₹2Cr (1%) | ₹5Cr (1%) |
| Free Cash Flow (80% of PAT) — to General Reserve for expansion | ₹32L (6%) | ₹64L (6%) | ₹1Cr (6%) | ₹1Cr (6%) | ₹9Cr (5%) | ₹21Cr (5%) |
| Payback on PAT | 5 yrs | 5 yrs | 5 yrs | 5 yrs | 9 yrs | 7 yrs |
| Payback on retained FCF (80%) | 6 yrs | 6 yrs | 6 yrs | 7 yrs | 12 yrs | 9 yrs |
| 07 · Ratio Analysis | ||||||
| Gross Margin % | 34% | 34% | 34% | 34% | 34% | 34% |
| EBITDA Margin % | 14% | 14% | 14% | 14% | 14% | 14% |
| PAT Margin % | 8% | 8% | 8% | 8% | 6% | 7% |
| ROIC (PAT / Invested Capital) | 20% | 21% | 20% | 18% | 11% | 14% |
| ROE (PAT / Equity) | 40% | 41% | 40% | 37% | 21% | 28% |
| Hurdle rate (self capital opportunity cost) | 18% | 18% | 18% | 18% | 18% | 18% |
| ROE vs Hurdle — margin over 18% | 22% | 23% | 22% | 19% | 3% | 10% |
| Years to clear loan + capital | 4 yrs | 4 yrs | 4 yrs | 4 yrs | 7 yrs | 5 yrs |
| Current Ratio | 4.7 | 4.7 | 4.7 | 4.7 | 4.7 | 4.7 |
| Quick Ratio | 2.7 | 2.7 | 2.7 | 2.7 | 2.7 | 2.7 |
| Working Capital Turnover | 2x | 2x | 2x | 2x | 2x | 2x |
| Debtor Days | 90 days | 90 days | 90 days | 90 days | 90 days | 90 days |
| Inventory Days | 90 days | 90 days | 90 days | 90 days | 90 days | 90 days |
| Inventory Turnover | 4x | 4x | 4x | 4x | 4x | 4x |
Methodology: Revenue ₹10,000/sq ft of factory area · Material 50% of revenue · Headcount = Revenue ÷ ₹25 Lakh/person (25–100 boards/day) or ÷ ₹50 Lakh/person (500–1000 boards/day) · Average salary ₹40,000/mo (25–100B) or ₹80,000/mo (500–1000B) · Manufacturing salary + direct G&A 16% of revenue (absorbed in COGS) · Showroom + Sales + Admin OpEx 20% (includes sales team salary) · Depreciation 15%/yr on machines · Interest 12% on secured bank loan (P&L expense) · Self capital opportunity cost 18% (hurdle rate only, shown in Ratios) · Tax 25% · Total Capex Required = Caple m/c (100) + Supporting m/c (20) + Working Capital (90 days) + Bank/Buffer (30 days) · Funding: 50% self investment + 50% bank loan · 32 sq ft per 8×4 board at 80% yield · 25 days/month · Factory area at 200 sq ft per board/day benchmark · PAT split: 20% Drawings (owner withdrawal) + 80% Free Cash Flow retained to General Reserve for expansion.
Disclaimer: The figures above are indicative planning figures for a greenfield modular furniture factory in India, Middle East or Africa. They are not a forecast, guarantee or investment recommendation. Actual results depend on project location, product mix, order book, labour productivity, utility costs, taxation, interest rates, foreign exchange and commodity prices. Caple Industrial Solutions is a machinery consultancy, supplier and service partner — not an investment advisor. Please validate all assumptions with your Chartered Accountant, banker and project consultant before committing capital.
Disclaimer: The figures above are indicative planning figures for a greenfield modular furniture factory in India, Middle East or Africa. They are not a forecast, guarantee or investment recommendation. Actual results depend on project location, product mix, order book, labour productivity, utility costs, taxation, interest rates, foreign exchange and commodity prices. Caple Industrial Solutions is a machinery consultancy, supplier and service partner — not an investment advisor. Please validate all assumptions with your Chartered Accountant, banker and project consultant before committing capital.
SWOT — Before You Invest
An honest strategic view of the modular furniture factory opportunity in India, Middle East and Africa.
Strengths
Why this business works
- Proven unit economics: 33% gross margin, 13% EBITDA and 8% PAT consistent from 25 to 1000 boards/day.
- Turnkey support: 50+ years of field service across India, Middle East and Africa with factory-trained engineers.
- Strong brand portfolio: Nanxing, Lamello, SCM, Festool, Bessey, Orma — best-in-class in every category.
- Rapid payback on retained FCF: 1–2 years for 25–100 board factories using only 50% of PAT.
- Scalable team template: 1 person per 20 boards/day with clear departmental split.
- Live catalogue pricing: capex and specifications published transparently on caple.in.
Weaknesses
Operational challenges to plan for
- Working capital intensive: 45 days each of RM, WIP, FG and debtors — plan 3–4 months of revenue in WC.
- Skilled talent scarcity: CAD/CAM and machine operators rare in Tier-2 and Tier-3 cities.
- Site readiness: stable 3-phase power + clean dry compressed air often need upgrades.
- Environmental compliance: reverse-pulse-jet dust extraction plus periodic audits required.
- Installation ramp: 14–20 weeks from order to trial production.
- Capital-heavy at scale: 500+ board factories need ₹35+ Cr capex with extended payback at 1 shift.
Opportunities
Tailwinds to capture
- Modular kitchens and wardrobes: growing 15% CAGR across metros and Tier-2 cities.
- Government initiatives: PMMY, CGTMSE and MSME subsidies cut cost of capital 2–3%.
- Export demand: Middle East, Africa and South Asia want Indian modular furniture at competitive prices.
- Contract manufacturing: large brands outsource batch-size-1 production to captive units.
- Project business: hotel, office and hospital fit-outs with ₹1–5 Cr order sizes.
- Vertical integration: lamination, soft-forming and hardware assembly add 3–5% GM.
Threats
Risks to monitor
- Raw material volatility: MDF, particle board and hardware can swing 10–15% seasonally.
- Imported finished goods: Chinese and Vietnamese cabinets entering metros.
- Currency exposure: on imported machine spares and electronics.
- Labour inflation: operator wages rising 8–10% YoY, compressing margins.
- Interest rate cycle: RBI repo rate changes impact 50% loan-funded capex.
- Technology obsolescence: automation evolves fast — engineering talent retention is critical.